Advanced Analytics & Visualization
Transform simulation results into actionable insights through sophisticated visualization and analytical tools.
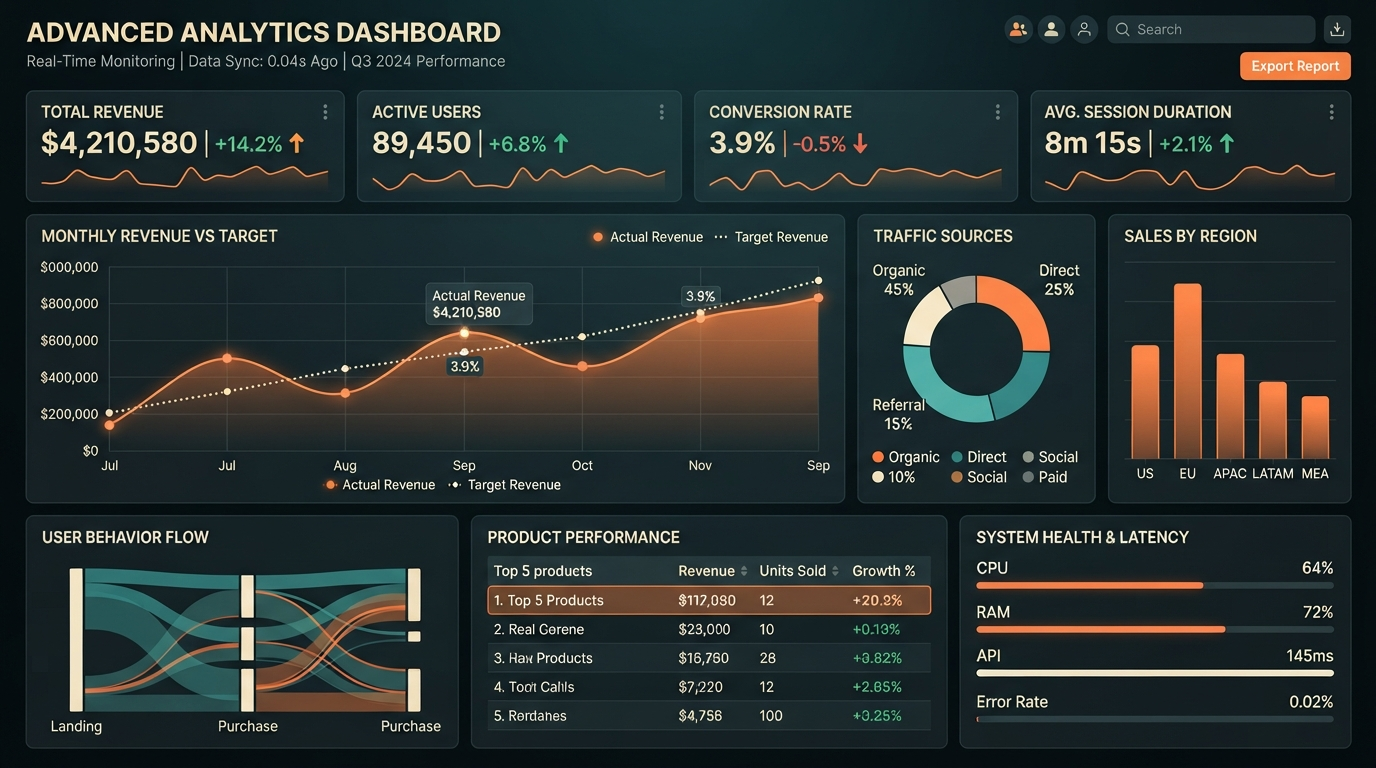
Real-Time Analytics Dashboard
Monitor simulation progress and explore results in real-time. Customizable dashboards display key metrics, trends, and performance indicators as simulations run.
- ✓ Live KPI tracking and alerts
- ✓ Multi-dimensional data slicing
- ✓ Drill-down analysis capabilities
- ✓ Custom metric definitions
Visualization Capabilities
3D Spatial Visualization
View your simulated systems in full 3D. Interactive camera control and layer visualization help you understand spatial relationships and dynamics.
Temporal Animation
Watch your systems evolve through time. Slow down, pause, and rewind simulations to understand system behavior at any point in time.
Interactive Charts
Extensive chart library including time series, distribution plots, scatter diagrams, and more. Customize colors, axes, and data series for optimal presentation.
Network Diagrams
Visualize complex relationships and flows. Track connections, identify bottlenecks, and understand network structure through graph visualization.
Heat Maps
Identify hot spots and patterns. Color-coded heat maps reveal concentration patterns, utilization levels, and areas of concern.
Custom Reports
Generate professional reports combining charts, tables, and narrative analysis. Export to PDF, PowerPoint, or Excel formats.
Advanced Analysis Tools
Sensitivity Analysis
Determine which parameters drive system behavior. Create tornado charts and sensitivity profiles to identify critical factors and drivers of variability.
Correlation Analysis
Explore relationships between variables. Identify correlations, dependencies, and interaction effects that influence outcomes.
Statistical Analysis
Comprehensive statistical tools including distributions, confidence intervals, and hypothesis testing. Understand result uncertainty and confidence.
Trend Forecasting
Project future trends based on simulation results. Identify patterns and make predictions about system behavior under different conditions.
Comparative Analysis
Compare scenarios, time periods, or configurations side-by-side. Understand relative performance and make informed decisions.
Unlock Insights from Your Data
Transform simulation results into actionable insights and strategic recommendations.
Learn More